Research Proposal
My Research Proposal, titled “Algorithmic Arias: Navigating the Melodic Maze of Music and Mind”, outlines the plan for my project. The primary focus of the current proposal is the development of a system for personalized music therapy through Affective Algorithmic Composition (AAC). This involves analyzing real-time emotional data from facial expressions to generate music tailored to an individual’s emotional state, with the goal of improving therapeutic outcomes. The plan includes creating a working prototype and gathering preliminary data through human trials.
Following the foundational plan laid out in the Research Proposal, my Research Deliverables document serves as a record of ongoing progress, tasks, and reflections throughout the year. This document captures the week-to-week work, detailing specific tasks completed, outlining upcoming milestones, and providing reflections on challenges and successes. Within these deliverables, you will find insights into the practical development of the project, such as:
- Progress made on the facial expression recognition web application, including troubleshooting issues and porting the code to Google Project IDX
- Efforts to integrate music playback functionality and synchronize audio data with facial expression data at corresponding timestamps.
- Work on implementing automated music component analysis tools, like setting up the PyTorch analyzer, and exploring different approaches
- Documentation of correspondence and meetings with mentors, Dr. Alex Pantelyat and Dr. Kyurim Kang, including feedback received on paper drafts and discussions about publication strategies.
- Preparation for presentations and manuscript development.
Notably, this research path built upon prior original data collection and analysis conducted in my first year of IR. This earlier work, also under the title “Algorithmic Arias,” involved a survey research design incorporating both descriptive and correlational research. Data was collected from 160 participants aged 12 to 78 in April 2024. The data included demographics (Age, Gender, Ethnicity) and information on music preferences and influencing factors, such as preferred genres, artists, listening frequency, and musical background. The hypothesis explored was that significant variations in music preferences and influencing factors would exist across different age groups. For this survey project, data was collected using Google Forms and analyzed using Google Sheets to create graphs, compute statistical measurements (like standard deviation and skewness), and develop working regression models. The aim was to explore the links between collected factors and the hypothesized variations in music preferences. This earlier survey-based research formed the foundation of a previous version of my paper that has been accepted by the Journal of Student Research. Feel free to access a more in-depth exploration of the methods and results of my earlier research here.
Data Overview
Understanding the dynamics of musical preferences across different age groups provides valuable insights into the cultural and emotional significance of music in people’s lives. This study aims to explore how various factors, such as demographics, listening habits, and prior musical knowledge, influence musical tastes and preferences. By employing a survey research design that encompasses both descriptive and correlational elements, this research seeks to identify significant variations in music preferences and the underlying factors driving these variations among different age groups.
Type of data collected
This portion of the study employed a survey research design that falls under both descriptive and correlational research. Data were collected from 160 participants aged between 12 and 78 as of April 26, 2024, encompassing demographic categories of age, gender, and ethnicity.
The questionnaire aimed to gather comprehensive information on participants’ demographics, music listening habits, and the influences shaping their musical preferences.
Data collection method
The online questionnaire was designed using Google Forms. The questionnaire was crafted to be clear, concise, and unbiased to minimize response bias. The questionnaire link was then distributed through various channels such as email, messaging and social media to reach a broad audience. You can find the questionnaire here.
Analysis Methods
The charting capabilities of Google Forms were used to extract primary data from survey responses and receive general summaries of results.
Google Sheets was used to create graphs, compute statistical measurements like standard deviation and skewness, and create working regression models. Information regarding favorite genres, artists, and mood-influencing kinds of music was collected with the intention of later cross-referencing the genres with the particular timbres they characterize. This can then be linked to certain age groups, people with a particular musical background, etc.
Results Interpretation
Analysis of the collected data reveals some interesting trends about how musical preferences and influences differ among different age groups.
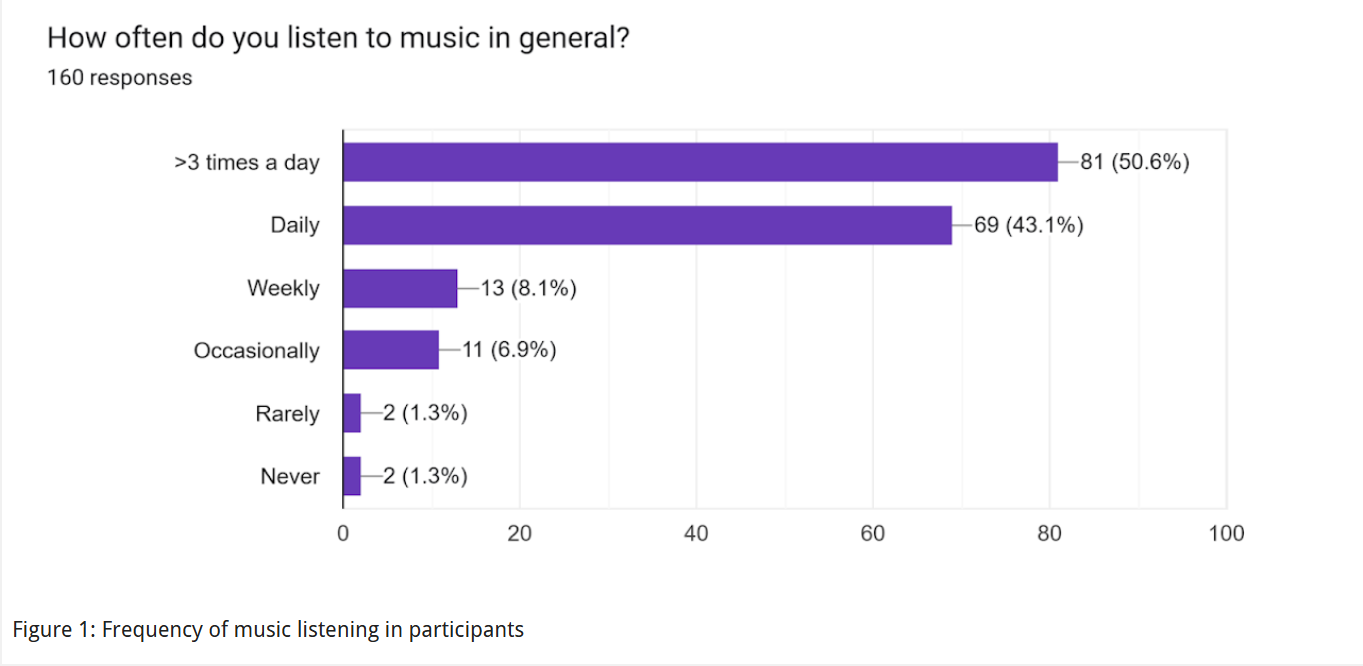
Figure 1 explores how often participants in the study reported listening to music. The data reveals a clear trend towards frequent music listening, with the majority (73%) indicating they listen to music daily or more than three times a day. Music plays a significant role in the daily lives of a large portion of the surveyed population, which may be attributed to the dominantly teenage composition of the group.
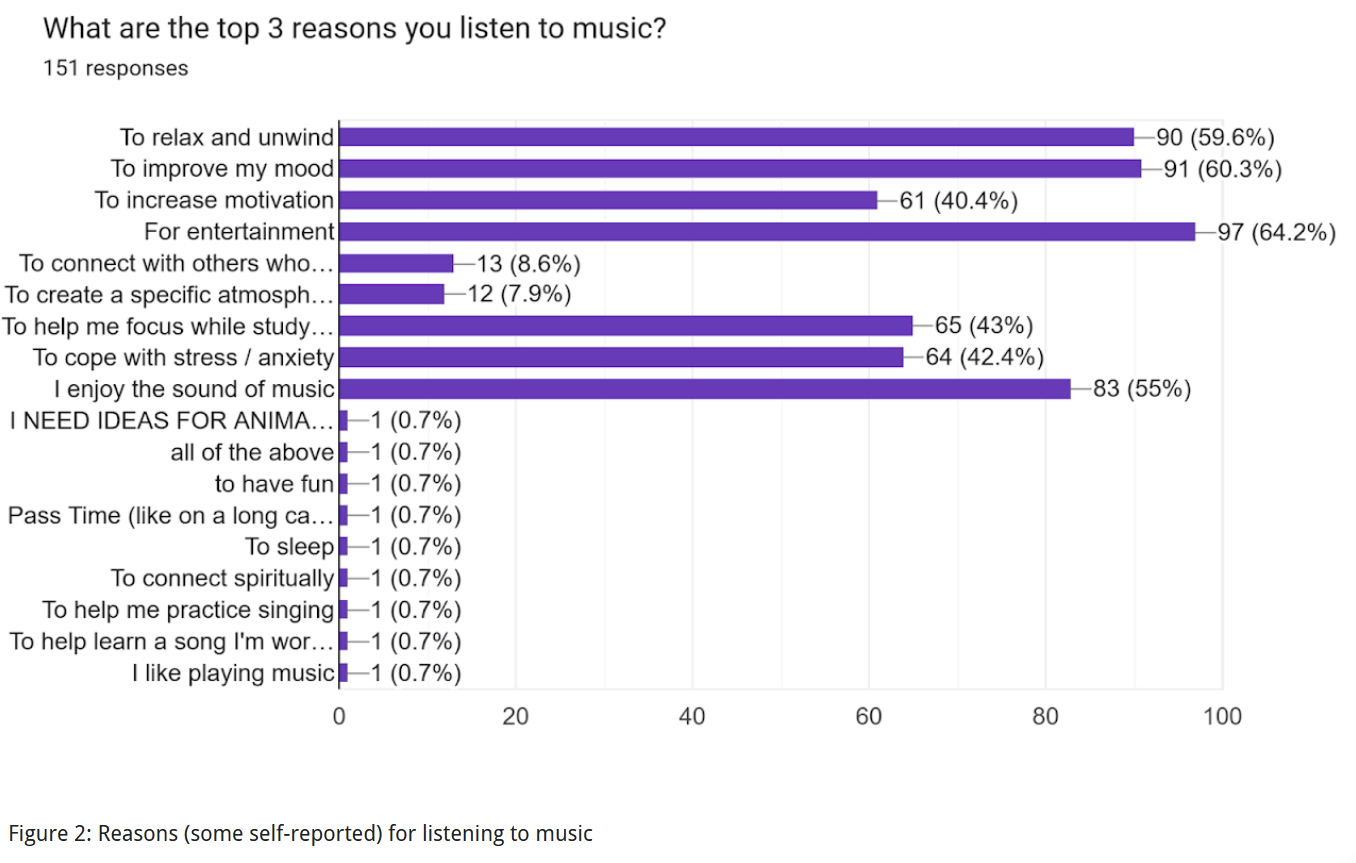
Regarding the information in figure 2, here’s what can be said about the top reasons why participants listen to music:
-
Relaxation and unwinding: This was the most popular reason, with 90 (59.6%) participants selecting it.
-
Improve mood: Closely following in popularity was improving mood, chosen by 91 (60.3%) participants.
-
Entertainment: 64.2% (97 participants) selected entertainment as a reason for listening to music.
-
Focus and concentration: While not a top 3 reason, a significant number of participants (65, or 43%) listen to music to help them focus while studying.
-
Stress and anxiety: Similarly, managing stress or anxiety was a reason for listening to music for 64 participants (42.4%).
-
Enjoyment of sound: Purely appreciating the sound of music itself was a reason endorsed by 83 participants (55%).
It’s also interesting to note that some participants (1%) provided their own reasons for listening to music that weren’t among the 9 pre-written options. These included finding ideas for animations, having fun, using music as a pass time (like on long car rides), using it to sleep, for spiritual connection, and to help with singing practice. Figure 2 affirms that people listen to music for a variety of reasons, with relaxation, mood improvement, and entertainment being the most popular choices in this study.
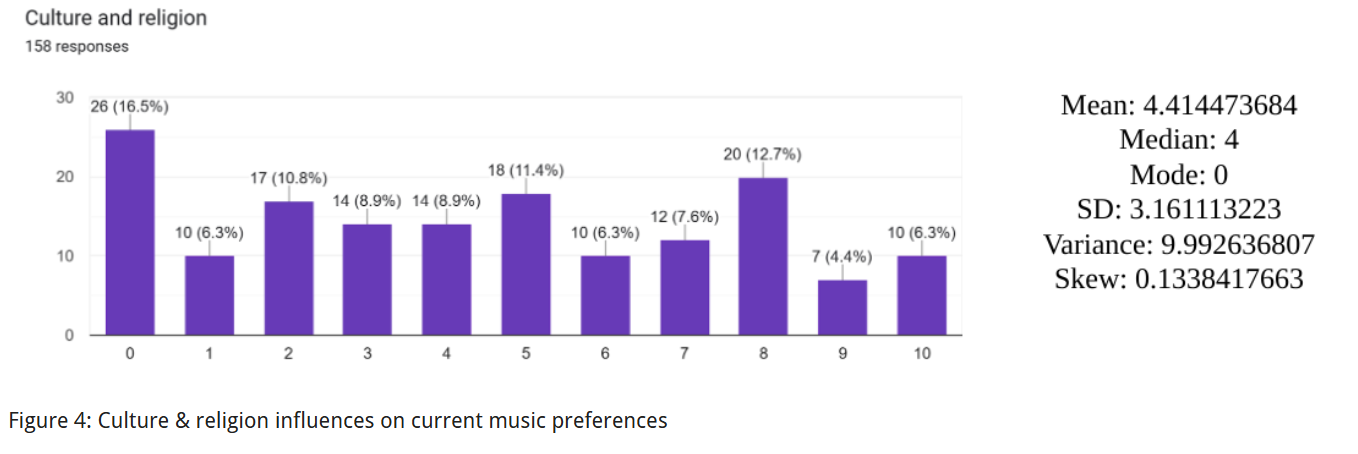
The influence of culture and religion on current music preferences (Figure 4) appears to be spread somewhat evenly across the rating scale, with a slight skew towards the lower end. This suggests that for a significant portion of the participants (around 63.3%), culture and religion have a moderate or low influence on their music taste. There is also a notable range of perspectives, with many participants indicating a strong influence and others perceiving little to no influence from these factors.
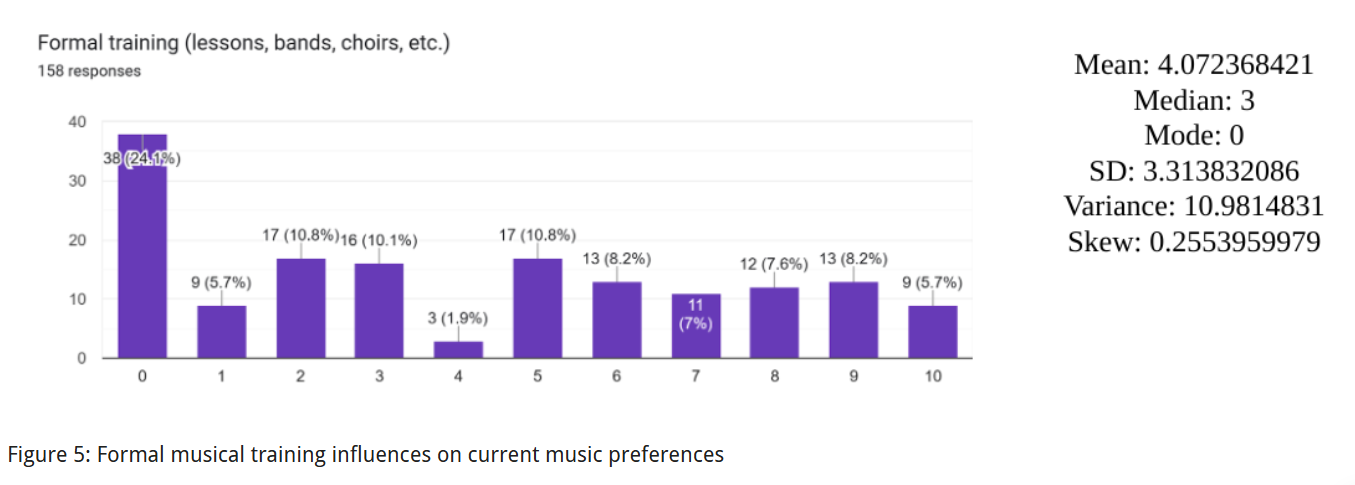
Formal music training (Figure 5) does not appear to have a universally strong influence on current music preferences among the participants in this study. There are distinct groups with opposing views on this topic, but for the majority of participants, any musical lessons had little to no impact on their current choice of music.
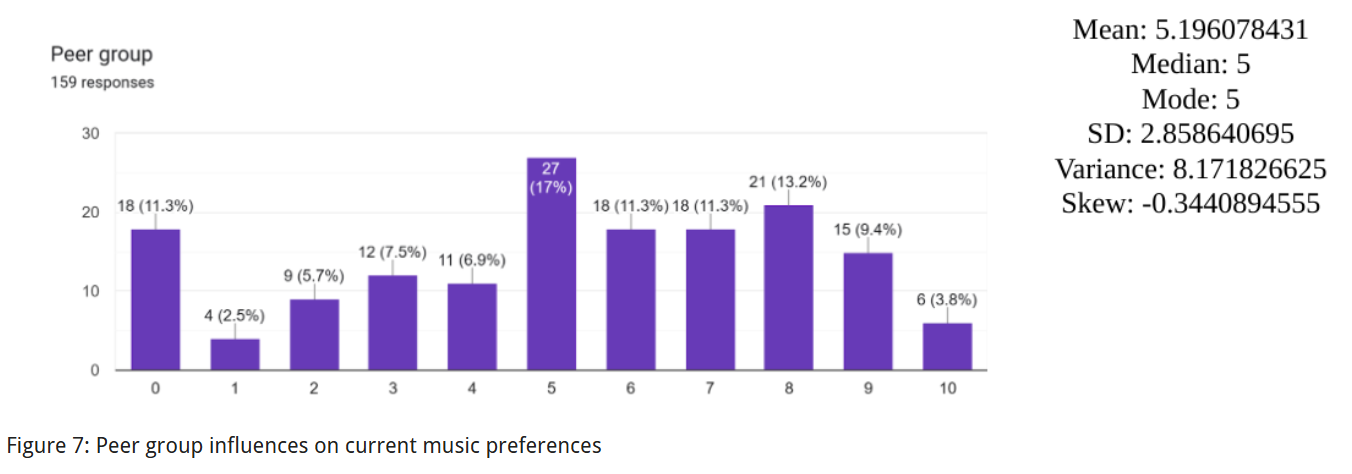
For most participants in this study, peer groups and social circles have a moderate influence on their current music preferences (Figure 7). However, there is also a range of individual experiences, with some participants reporting a strong influence from peers and others indicating a minimal impact.
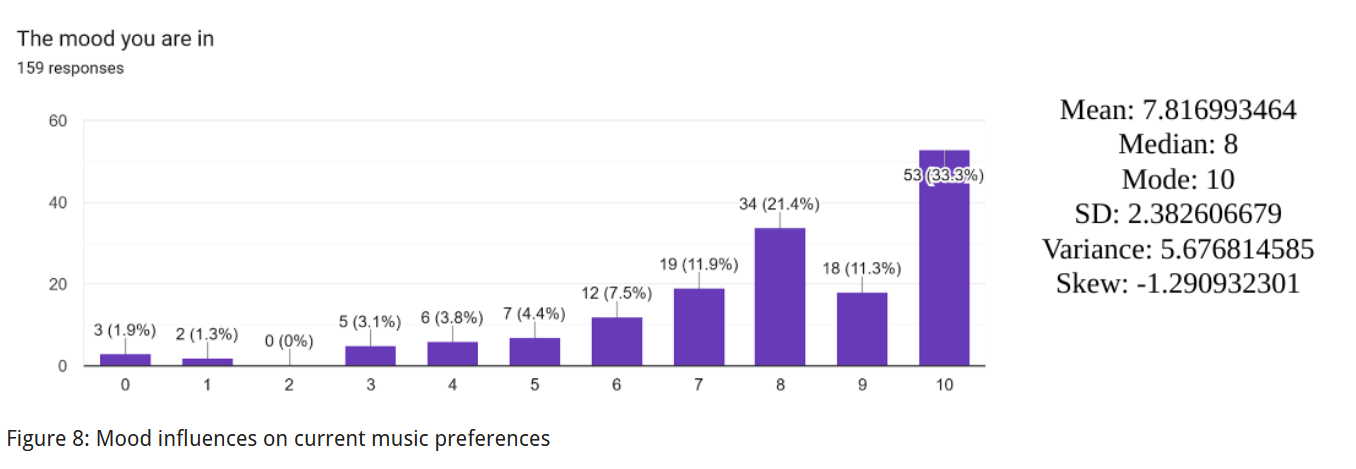
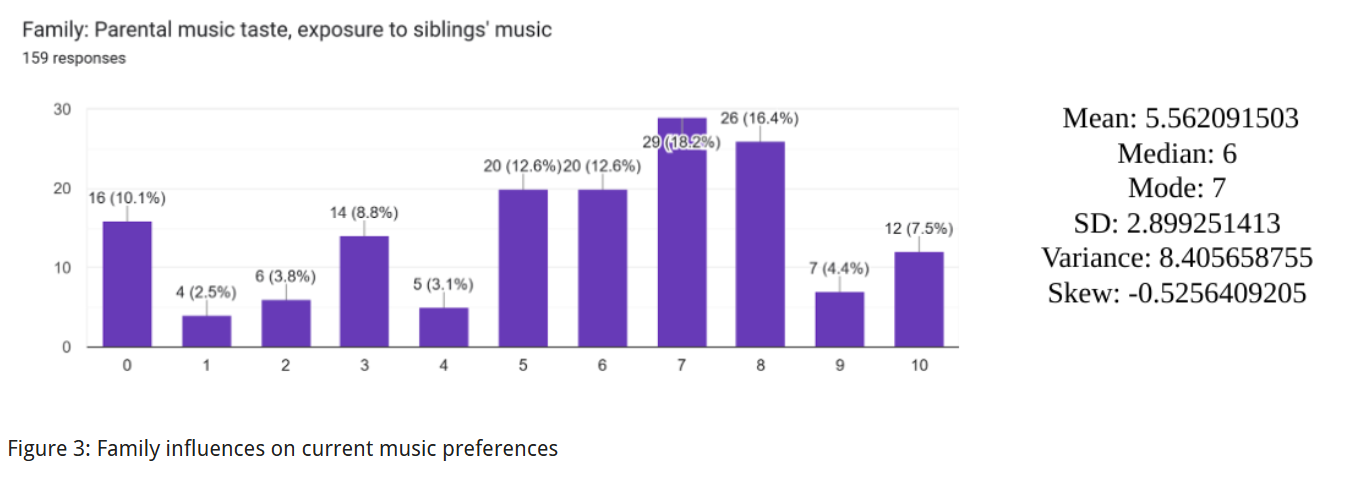
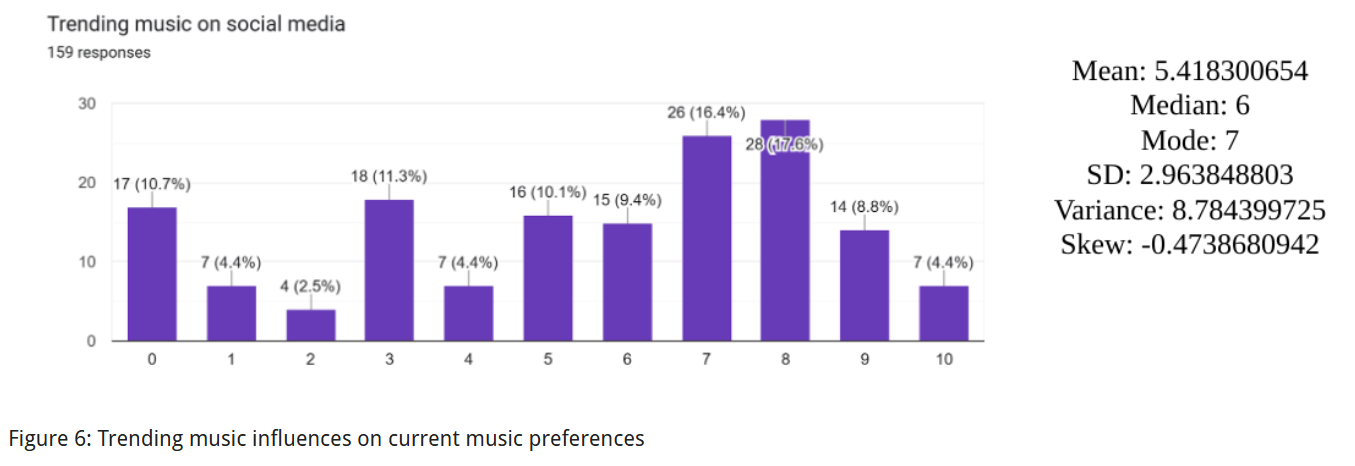
The impact of mood on musical preference is massively skewed left (Figure 8) indicating an apparent tendency to choose music that highly reflects one’s current mood, which also follows from common sense. Moderately skewed left are the effects of current trending music (Figure 6) and that of family (Figure 3). Participants tend to choose music that aligns somewhat with their family’s musical preferences, but he distribution also indicates some participants may deviate significantly from this trend. This could be due to a variety of factors, such as:
-
Individual musical exploration and discovery outside of family influence
-
Generational differences in music tastes
-
Family musical preferences being more diverse than initially perceived.
Similar to Figure 3, Figure 6 displays a moderately skewed left distribution. This suggests a tendency for participants to be somewhat drawn to currently trending music. However, the moderate skew implies there are also participants who are less swayed by current trends and may choose music based on other factors like personal favorites, genre preferences, or a conscious desire to avoid mainstream music.
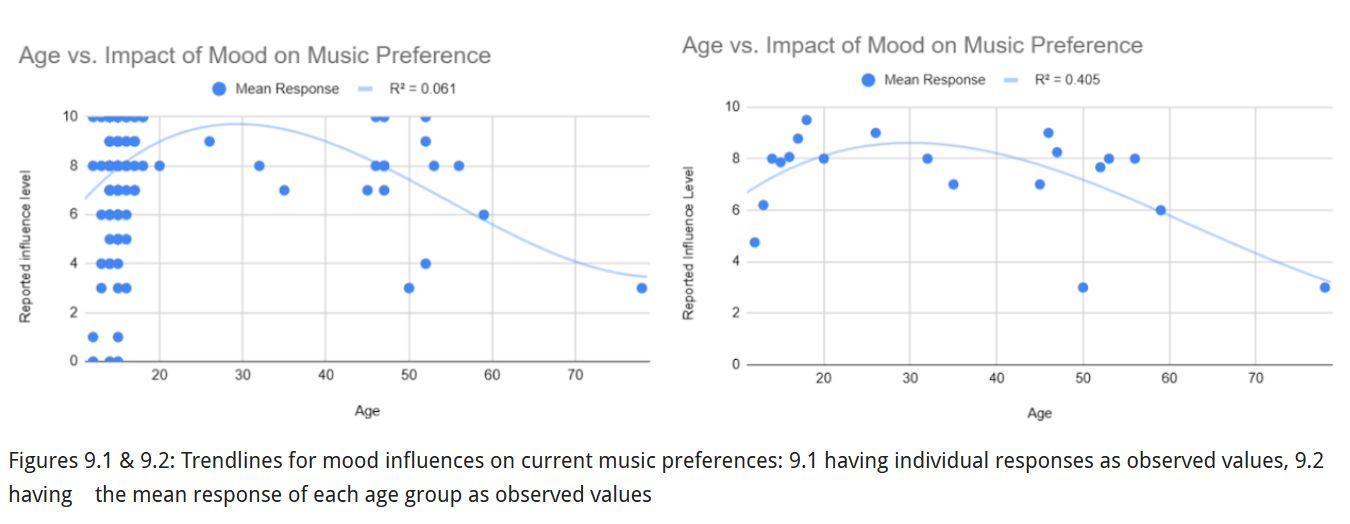
When age is compared to these impacts, a pattern (though with a chunk of the x-axis of age missing) arises showing a somewhat parabolic curve for emotional impact, suggesting that there may be an age or period of life where mood has a greater influence on the musical habits of the average person. However, a cubic regression yields the R2 value to be only about 0.068 (Figure 9.1), which limits our ability to definitively establish a correlation between age and the emotional impact of music – though the curve does hint at a potential period in life where mood might play a stronger role in music selection. Upon further adjusting via averaging the y-value for each age via the mean, the R2 value rises to 0.402, still indicating a low correlation, exacerbated by the high variance in this data (Figure 9.2). These findings warrant further investigation and data collection (i.e. sheer number of responses from more diverse age groups) to facilitate even more pattern-seeking and to understand all the nuances of how these factors shape music preferences.